I played a little more with my tiny project of predicting the price of used cars. Though I already passed the assignment review I initially pepared the data for, I kept nudging the simple model, and I also tried it in on new data.
(I already wrote about the project here, but long story short: I scraped the data of a bunch of used car listings (Ford Focuses, more precisely), to understand what determines the price the seller asks for a specific car.)
The model
After tweaking the model here and there, I ended up throwing out all the categorical variables (like form variant, fuel or transmission type, etc.), as even if they are significant in the statistical sense (ie. probability of the coefficient being zero is sufficiently low), their impact on the predicted price was limited.
So only three variables remained: age, mileage/year and horsepower. These together can explain about 92-93 percent of the variability in the price.
Update: Adding fuel type and transmission type does seem to provide some extra information, even though it just slightly improves the explaining power (r2) of the model. I describe the effects below. (Thanks, Csaba, for pushing this.)
When creating the model I followed the well-known recipee: I trained the model on one part of the initial dataset and tested on the remaining data. This already confirmed that I managed to avoid the greatest pitfalls (the model works roughly the same on both sets). Still, I was curious whether it would work on new data, too, so I dusted off my scraper script, and quickly collected the new listings that were published after my first round in July.
Sidenote: the new dataset contains roughly half as many observations as the initial one, which hints that on average a listing is active for about two months. Apparently this is the time it takes to sell your Focus. (I haven’t checked exactly how many of the initial listings were already inactive, but the overall number of listings was more or less the same).
Here are the most important conclusions, based on the model (and here’s the updated Jupyter Notebook with the code):
The price falls 13 percent for every year of the age of the car
On average the value of your Ford Focus will be halved in just 5 years, no matter if you bought a brand new one or a rusty, 15 years old wreckage. (Obviously you’ll lose much more in absolute terms with the former.)
Every 20 percent increase in yearly usage decreases the price by 4 percent
If there’s two cars with the same age and similar properties, like engine power, the one with the lower average annual mileage will be more expensive. Maybe even substantially, given the huge differences between mileage values. (No surprise that forging mileage is a profitable scam.)
You pay 4 percent more fore every 10 horsepower on average
If you think that 90 horsepower is weak, and you need 116, that’s okay. It will cost you almost 10% more, and you’ll have to cough up 14% more for upgrading to 130 HP (assuming every other feature stay the same).
Automatic transmission costs 6 percent more
That’s not surprising, but not a negligable difference either. You can get a Focus with manual transmission for somewhat cheaper on average (again, if all other factors are the same).
Gasoline is 3.4 percent more expensive
When you have to chose between two (almost identical) cars of which one runs on diesel, the other on gasoline, you tend to see slightly higher price tag on the gasoline model.
How it works on data
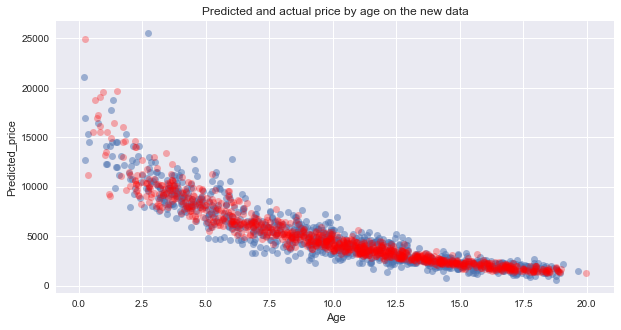
Here are the predictied prices (red) and the actual prices (blue) by age, first on linear scale. Note that the model is based on the log of the price, hence the wider spread on the left.

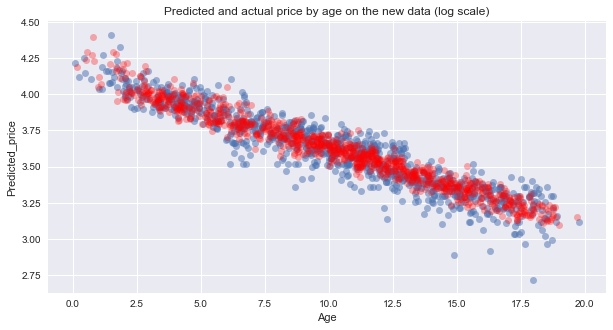
And the same on log scale. The predictions fall on a visibly narrower path, but in general it seems like a rather good fit in most cases.

Limitations
Although I threw out categorical values from the model, I used some of them as filters for data. That also means that the model is only valid (if it’s valid at all) for used Ford Focuses, that:
- are in undamaged condition (at least according to the seller).
- ran at least 1000km, and were manufactured before 2017 (to avoid new cars and data errors).
- are not the C-max variant, as it later became a separate model.
- have less than 200 HP, practically filtering out the crazy expensive RS tuning versions.
- are not older than 20 years, as Ford Focus was introduced in 1998 (those are most probably typos).
- have valid, Hungarian documents.
These criteria are meant to control for many of the outliers or categories with obviously different characteristics than the vast majority of the population. But also limit the applicability on raw data.
On top of that I’m not 100 percent sure that the model is completely free of any bias, or that I included the optimal selection of features (though I don’t have that many to chose from). Also, there are so many ways to model the prices, mine is unlikely to be the best.
And there’s still one more very interesting question: Are all these findings true for other brands and models? Maybe I will go after this one, too.