I don’t know much about buying a car, I’ve never done that and I don’t plan to do it soon. But nevertheless eventually I might have to face the challenge, and why would I do it without data? So, I was curious whether I can put together a funny little data project from the used car market.
Getting my own data
For an assignment called ’Exploratory Data Analyis’ on Udacity I skipped the tidy and clean, but rather boring learning datasets, and scraped the data of little more than 2500 listings of used Ford Focuses from Hasznaltauto.hu. This is not a gigantic dataset, but it was enough for the sake of this project.
I primarily picked Focus because it was the model that first came to my mind, and it turned out to be one of the most popular models on the site (based the number of listings it’s second after Opel Astra in tie with Volkswagen Golf). It also has almost 20 years of history, several variants are out on the market, so it seemed like a good candidate for a little analysis.
The process
I used Python for the scraping, and even though I knew it’s not a very complex task, it went surprisingly smooth. It took some two hours including most of the data cleaning. I’m not sure that even a few months earlier I could have pulled it off this easy (or at all). These milestones matter in learning.
For the Udacity project I had to use R, and I had my fair share of struggles and frustration with it. By the end I got somewhat used to R and R Studio, maybe even started to like ggplot, the library I used for the charts below (I just picked a few here, the assignment report contains close to 30 plots.)
I only collected the basic details of the listings, not including additional fields, like detailed technical and comfort specifications and the long descriptions from the sellers (these definitely hold valuable data, but it was out of scope now). I got rid of listings where there was no price indicated, also excluded damaged cars (at least that were stated as damaged) and every car that had mileage under 1000 kilometers to focus on the used but intact ones.
How much does a Focus cost?
Naturally I did not find anything that would fundamentally change how we should think about life and death or our role in the universe. But that was not the point, anyway.
Based on the data you can buy a (very) used Ford Focus for as little as EUR 400, but if you are looking for the extremes, you might have to cough up over EUR 40.000 for some crazy tuning versions or the rare electric models. Those are the outliers (excluded from the plots below), but around EUR 20.000 there are already quite a few ‘normal’ ones for sale too. But what how much the seller asks for one? My guesses were mileage and age.
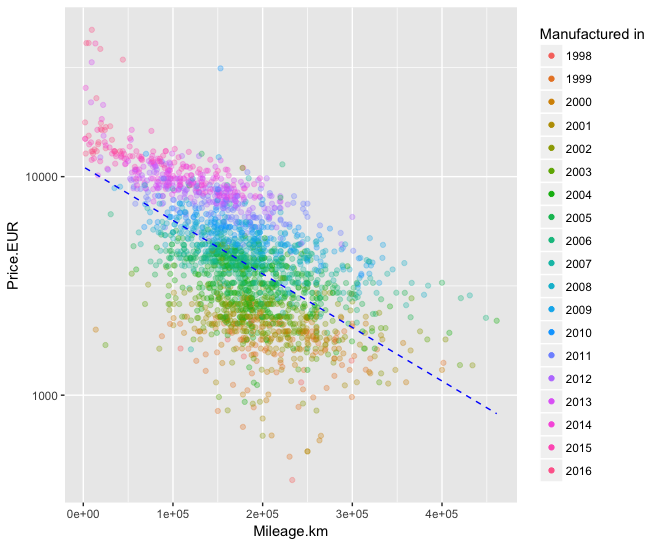
If we plot price on a log scale against the mileage (as stated by the seller, which we know is not always true), we clearly see a negative relationship. The higher the mileage, the lower the price tend to be. But the points are rather dispersed, so it should not be a surprise that mileage can only explain 37% of the variation in the price, if we use it in a linear regression model as the sole predictor.

Age is what matters
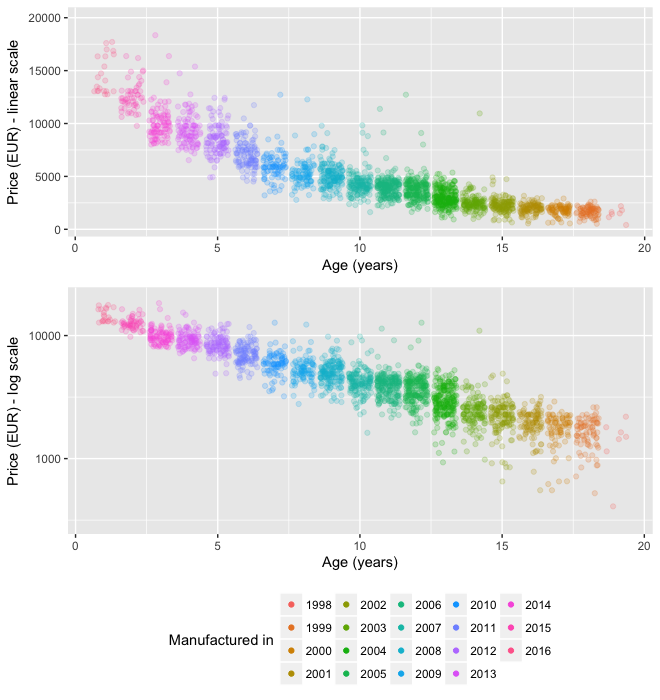
On the other the nice rainbow-like color pattern hints that there should be some connection between age and price, too. If we switch the plot to reflect this relationship, we get a much clearer picture. In itself it can explain 83% of the (log) price variation.

Also it’s worth noting the progressive decrease in price at lower ages, more visible on the top chart with linear scale. Putting it very simply: when you own a fancy new(ish) car, you’d better be prepared to lose at least half of its value in the matter of only five years, or even less.
This ratio might change for different brands and models, but the message is clear: owning a car is just consumption, it will not ‘keep its value’, as some might hope. (For older cars the price erosion is much slower, but let’s not forget higher administrative and service costs that might occur for those.)
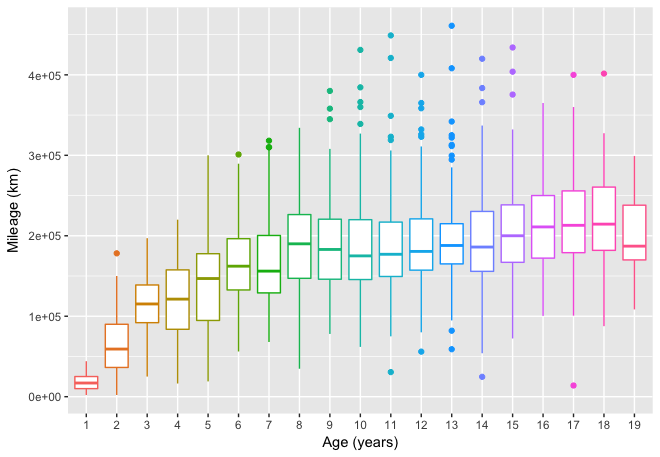
Plotting age against mileage reveals an interestingly mixed picture: the ’typical’ mileage increases by age only at the first 5-6 years, but above that changes just slightly. For older cars the mileage range is wide but seemingly independent from age (and apparently it’s rare you can use a Ford Focus for more than 400-450 thousand kilometers).
 Mileage is about the same for older cars
What else is in there?
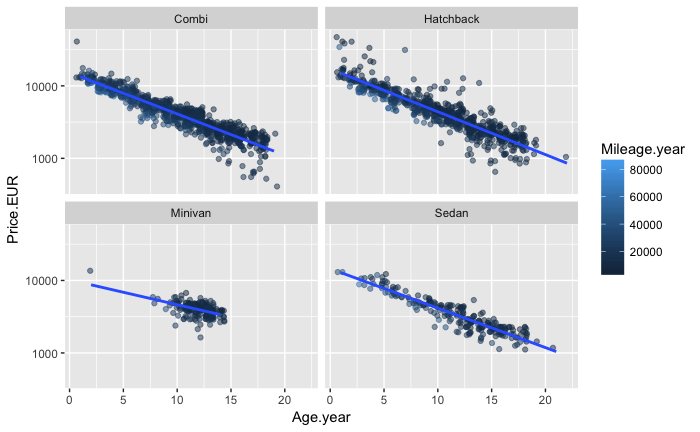
So, age is important, sometimes mileage is too, but I guess there’s more in the pricing. Besides age and mileage I included some other categorical features, like the type of fuel (gasoline is slightly cheaper), form variety (minivans tend to be slightly more expensive than the others) and the horsepower of the engines (the smaller the cheaper) into a linear regression model.
 (Minivans really differ from the other main varieties.)
This model apparently can explain 90% of the variations in price, which is cool, but I don’t think it’s completely free of any statistical biases, so it needs some more tweaking before I accept its predictive powers. Also, there is much more data hidden in the listings, and not just for Ford Focuses, so it would be too early to conclude.
(Note: The data was obtained several weeks ago so it’s already pretty outdated. Also, this sample represents only a tiny fraction of all the listings of Hasznaltauto.hu, and not intended for any purposes other than this learning project. I am not affiliated to Hasznaltauto.hu in any form.)